Meridian Group — CFO Intelligence Platform
<!--
Work info
-->
Role:
End to End Completed Project includes roles like Business Analyst, Data Analyst, Financial Analyst, Project Manager,
Year:
2026
Project Overview
Built a complete end-to-end CFO Intelligence Platform for Meridian Group — a fictional 4-division Indian conglomerate — simulating a real corporate finance environment from raw data generation through to a 6-page executive Power BI dashboard
Designed to solve a real business problem: finance teams manually reviewing thousands of transactions at month-end close, with anomalies staying hidden in the data for days before detection
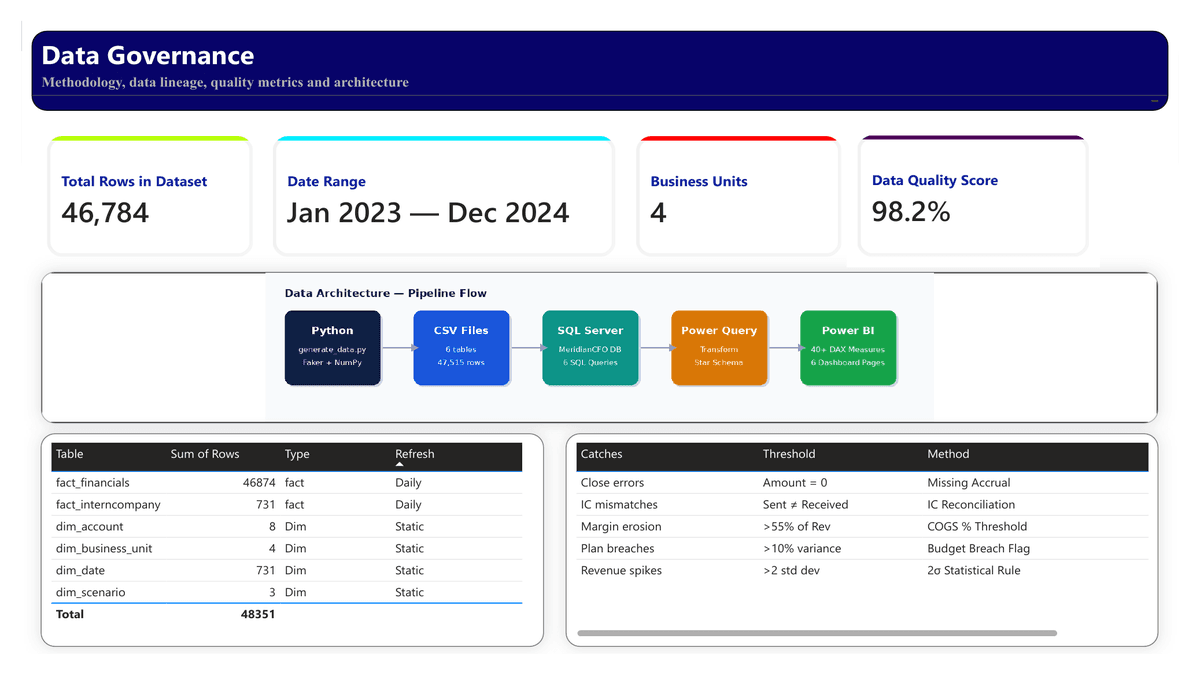
The platform automatically detects every financial irregularity using a 2-sigma statistical methodology consistent with forensic accounting and fraud detection practice
The Data Pipeline
Generated 47,515 rows of realistic synthetic financial data using Python, Pandas, NumPy, and Faker across 4 business divisions and 2 full fiscal years (2023–2024)
Built 6 structured tables in a star schema — dim_date (731 rows), dim_business_unit (4 divisions), dim_account (8 P&L lines), dim_scenario (Actual, Budget, Prior Year), fact_financials (46,784 rows), and fact_intercompany (731 rows)
Incorporated seasonality multipliers, 8% year-on-year growth, daily transaction granularity, and independent Budget scenario generation with realistic plan-vs-actual variance
Deliberately planted 5 financial anomalies into the dataset to simulate real-world close errors and test the detection system end-to-end
SQL Server Analytics
Designed and loaded the MeridianCFO star schema database in SQL Server using SQLAlchemy and PyODBC
Wrote 6 production-grade analytical queries using CTEs and window functions covering revenue variance analysis, full P&L budget vs actual, rolling 12-month EBITDA trends, intercompany reconciliation, 2-sigma statistical anomaly detection, and missing accrual identification
Applied NULLIF division-by-zero protection, account-type-aware variance direction logic, and dynamic string concatenation for human-readable audit recommendations
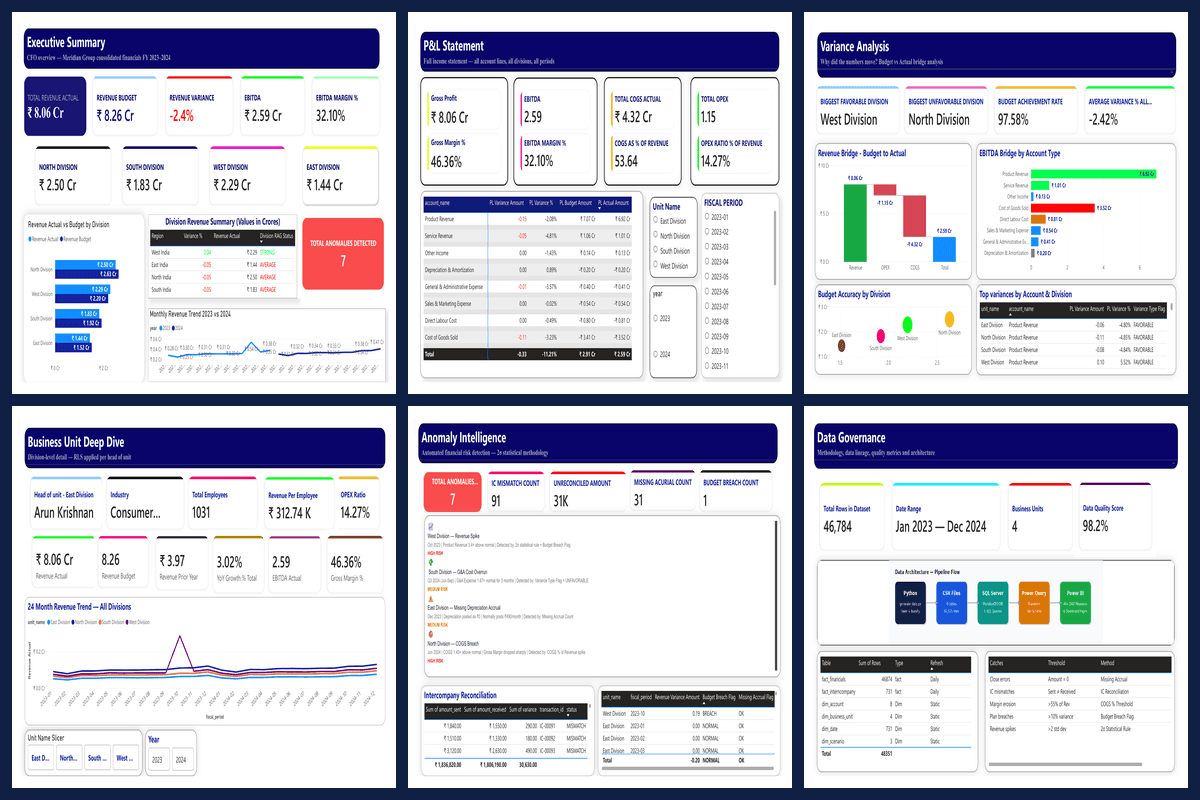
Power BI Dashboard — 6 Pages
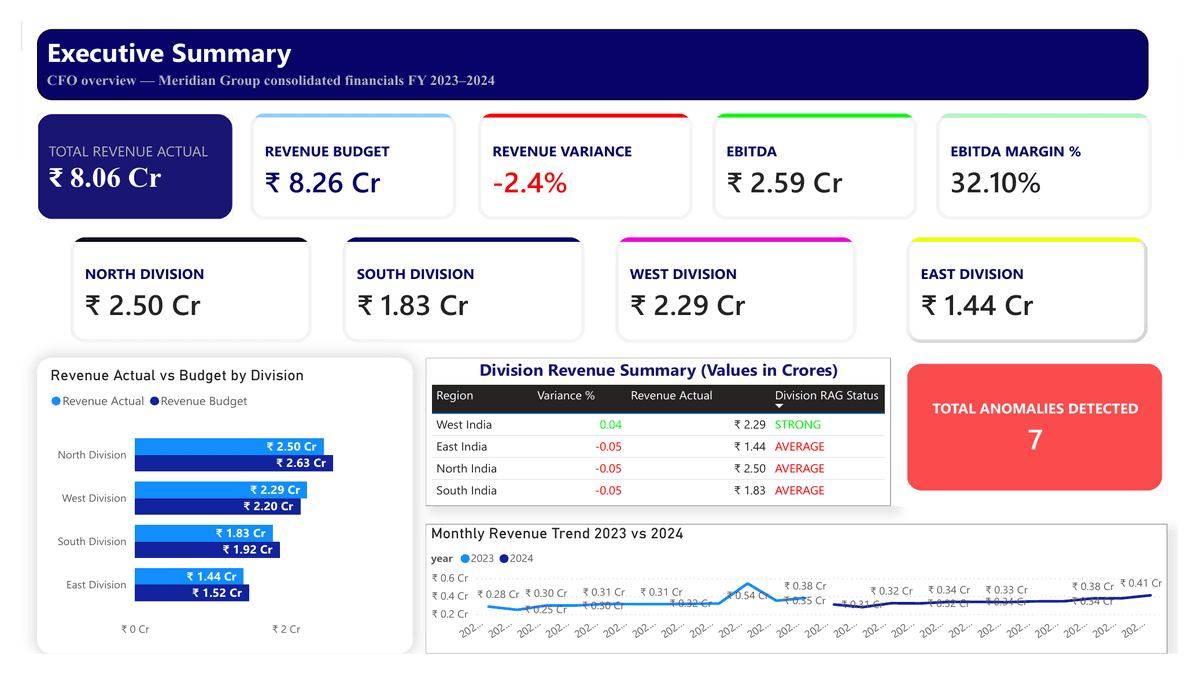
Page 1 — Executive Summary: 5 headline KPI cards, 4 division revenue cards, RAG status table, monthly revenue trend line chart, and Total Anomalies Detected card displaying 7
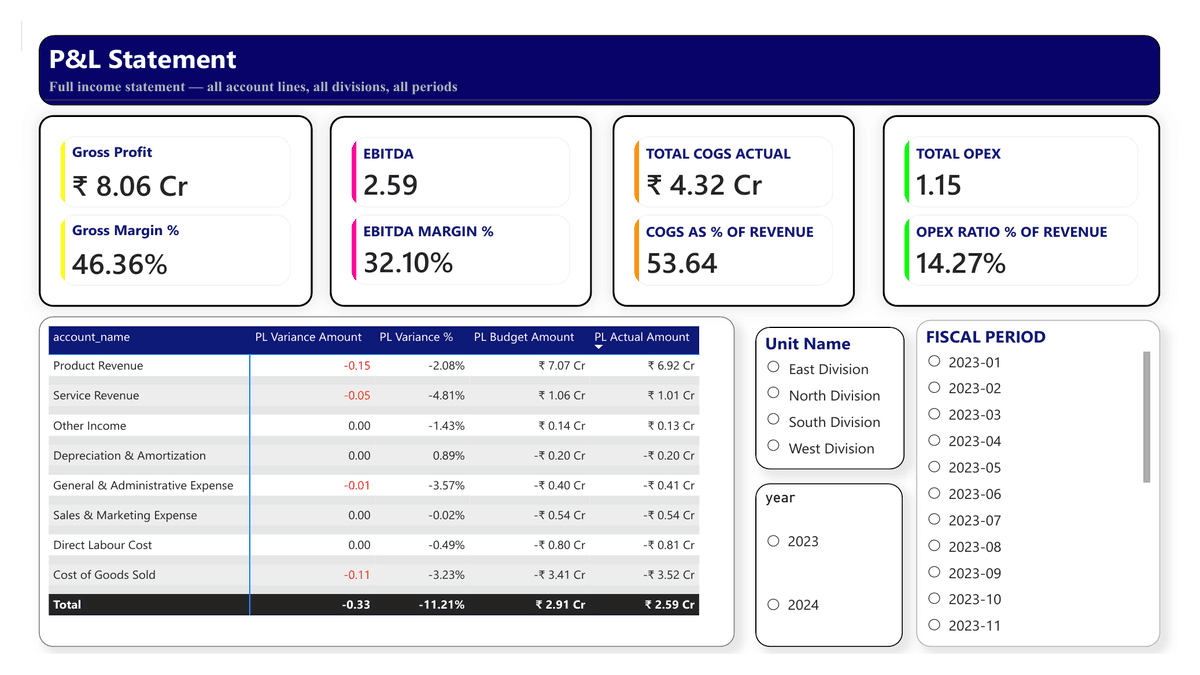
Page 2 — P&L Statement: Full income statement matrix with 8 account lines, conditional formatting (green for favorable, red for unfavorable), and 3 interactive slicers
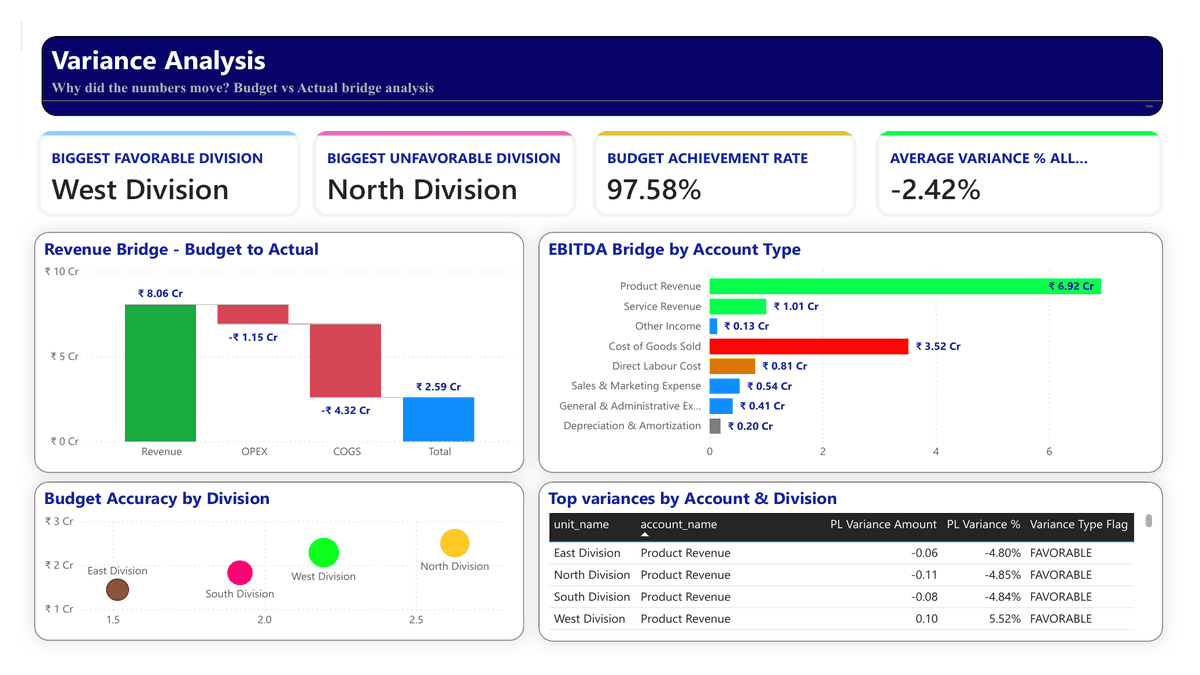
Page 3 — Variance Analysis: Waterfall bridge chart, EBITDA bridge bar chart, budget accuracy scatter plot, and top variances table
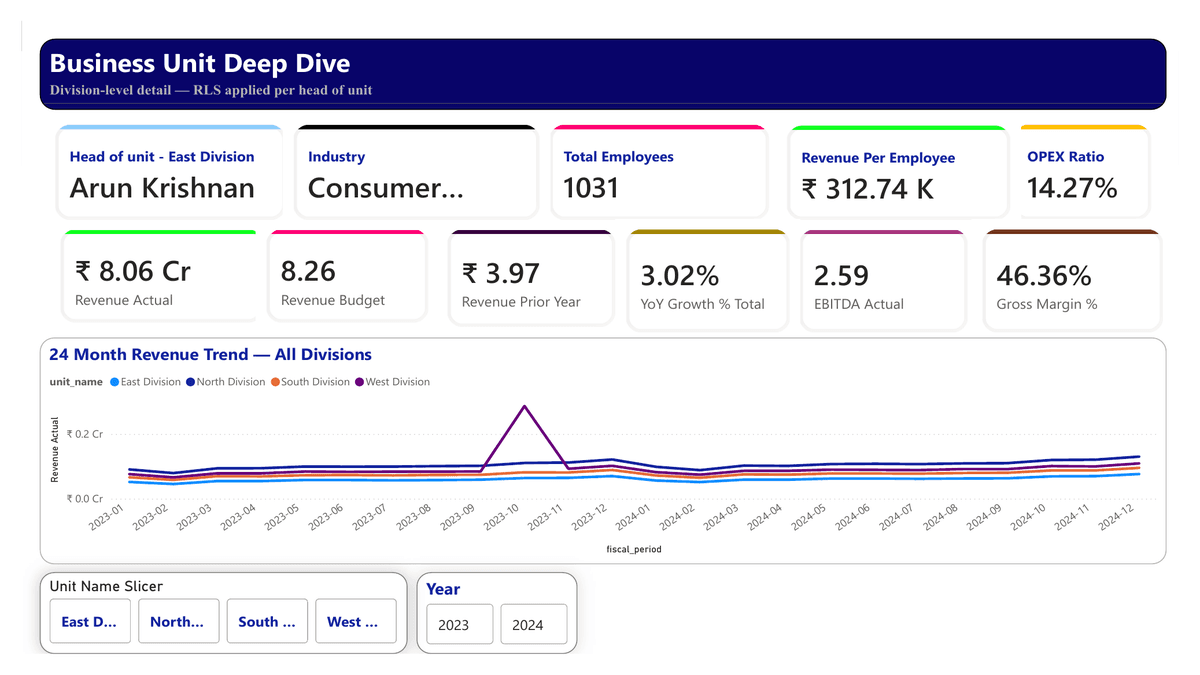
Page 4 — Business Unit Deep Dive: 24-month multi-division revenue trend, RLS-restricted divisional P&L, and 12 division-level KPI cards
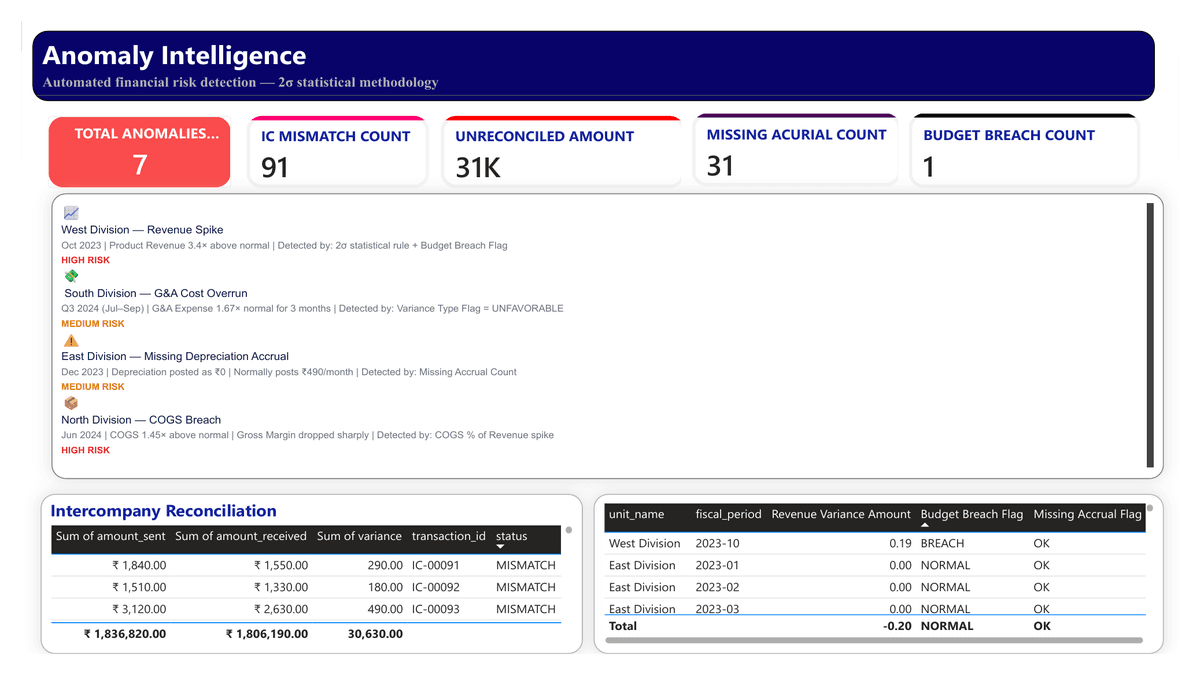
Page 5 — Anomaly Intelligence: Automated risk detection panel with 4 anomaly cards, intercompany reconciliation table, and 5 risk KPI cards
Page 6 — Data Governance: Pipeline architecture diagram, dataset inventory table, and anomaly detection methodology documentation
DAX Measures Library — 40+ Measures
Revenue: Actual, Budget, Variance, Variance %, YoY Growth, MoM Growth, YTD, Rolling 3-Month
Profitability: Gross Profit, Gross Margin %, EBITDA, EBITDA Budget, EBITDA Variance, EBITDA Margin %, Rolling 12-Month EBITDA
Cost: Total COGS, COGS % of Revenue, Total OPEX, OPEX Ratio %
Variance: PL Actual Amount, PL Budget Amount, PL Variance Amount, PL Variance %, Variance Type Flag, Budget Achievement Rate %
Anomaly: Budget Breach Flag, Missing Accrual Flag, Total Anomalies Detected, IC Mismatch Count, Total Unreconciled Amount, Division RAG Status
All measures validated in DAX Studio against Python-calculated benchmark figures
The 5 Anomalies Detected Automatically
🔴 West Division — Product Revenue 3.4× above normal — October 2023 — HIGH RISK
🔴 North Division — COGS breach, gross margin dropped sharply — June 2024 — HIGH RISK
🟡 South Division — G&A expense 67% above normal for 3 consecutive months — Q3 2024 — MEDIUM RISK
🟡 East Division — Depreciation accrual posted as zero — December 2023 — MEDIUM RISK
⚠️ 91 intercompany transactions unreconciled across 3 months — ₹31,000 exposure
Key Financial Outputs
Total Revenue Actual: ₹8.06 Crore
Revenue Budget: ₹8.26 Crore
Revenue Variance: -2.4%
EBITDA: ₹2.59 Crore
EBITDA Margin: 32.1%
Gross Margin: 46.4%
Budget Achievement Rate: 97.6%
Total Anomalies Detected: 7
Technology Stack
Data Generation: Python, Pandas, NumPy, Faker, SQLAlchemy
Database: SQL Server Express, PyODBC, MeridianCFO star schema
Analytics: 6 SQL queries — CTEs, window functions, 2-sigma statistical methodology
Visualisation: Power BI Desktop and Service, DAX, Power Query, Row-Level Security
Validation: DAX Studio
Version Control: Git, GitHub
Project Management: Jira Scrum — 6 Epics, 34 Stories, 6 Sprints